Chart
- Thor Thors
- Magnús Norðdahl
- Valgerður Sigurðardóttir (Deactivated)
- Atli Gíslason

The Kodiak Pro Chart Tool is a very versatile way to visualize marketdata for easy referencing and comparison.
The chart is divided into two main zones (metric and volume) controlled by two toolbars, and one information bar.
Using the chart you can -
- view information over chosen timeframes
- add additional instruments to the chart
- copy data to excel
- view different indicators such as SMA (Simple Moving Average), Bollinger bands, MACD and RSI
- view different series types (line, area, candle and OHLC)
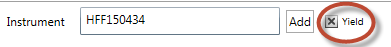
Adding an instrument
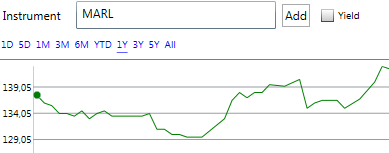
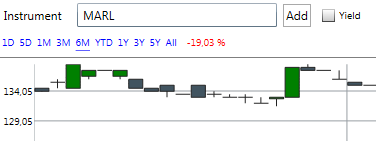
To add an instrument to the chart start typing the first letters of the symbol you want to add into the text box. Kodiak Pro will automatically show a drop down menu with bonds and stocks that correspond to your input. Select your instrument and press add. A graph for that symbol will be added to the chart. If the instrument is a bond you can also choose to show the yield of the instrument by checking the box next to Add -
You can add additional symbols to the chart, but certain components will only function with one, so we will focus on single-symbol charts.
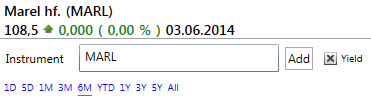
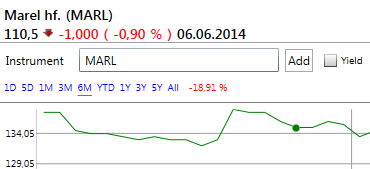
Information bar
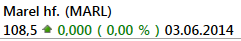
Basic information is displayed below the name of the symbol; Current stock price, an indicator whether the symbols is going up or down in price and how much in percentage the drop or strengthening is, and current date.
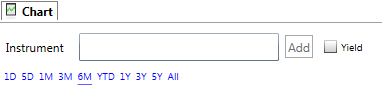
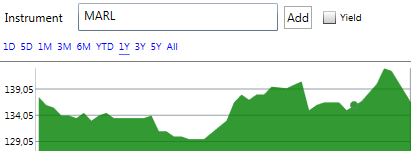
Toolbar
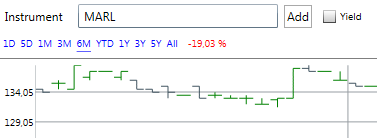
The toolbar is used to add symbols, and choosing what timeframe to display; 1 day, 5 days, 3 months, 6 months, Year to date, 1 year, 3 years, 5 years or all available data. The change in value of the stock for the chosen timeframe is displayed to the side of the timeframe buttons. 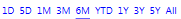
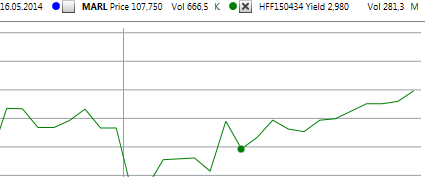
Hover over graph
You can get on-point information about the symbol if you use your mouse to hover over the graph. The date you're focusing on is displayed to the right, along with the price and volume at that date.
Display data / Copy data for spreadsheets
If you double-click the chart (or right-click and choose show data) you can view the data the chart is based on. From there it is easy to drag and choose cells to copy and paste into spreadsheets.
To re-open the chart, double click the data (or right-click and choose show chart).
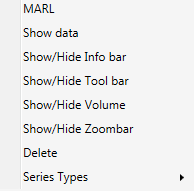
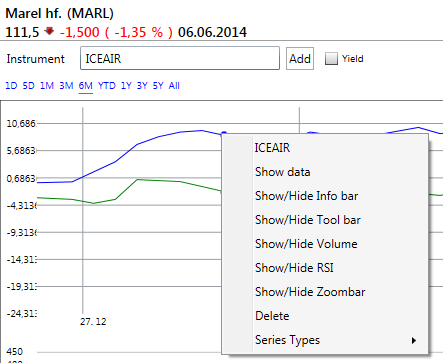
Context menu
By right-clicking anywhere on the chart you access the context menu. From there you can show or hide most functions within the chart, as well as change the graphs series types and add/remove indicators.
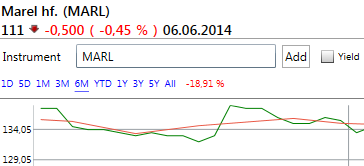
Series types
You can choose between four series types
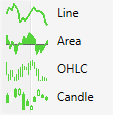
- Line (default). A simple graph showing the symbols progression.
- Area. Same as line, but gives a stronger contrast for reading.
- OHLC (open-high, low-close) Link to wikipedia.
- Candle (Candlestick chart). Link to wikipedia.
Indicators
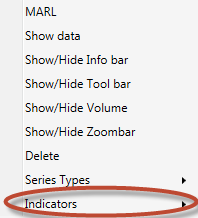
You can add four indicators to the chart, including three variations of simple moving average (SMA).
- Bollinger bands - Link to wikipedia
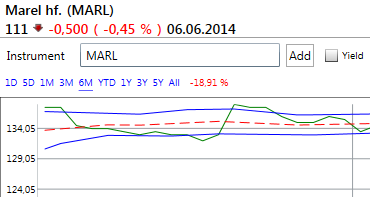
- SMA 10 / 50 / 200 - Link to wikipedia
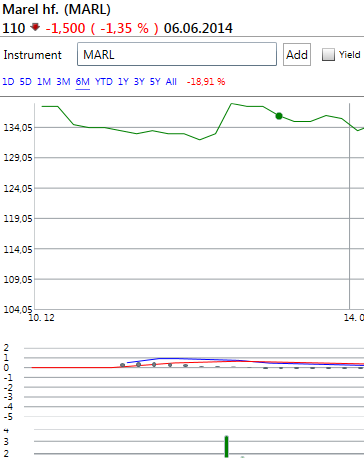
- RSI (Relative strength index) - Link to wikipedia
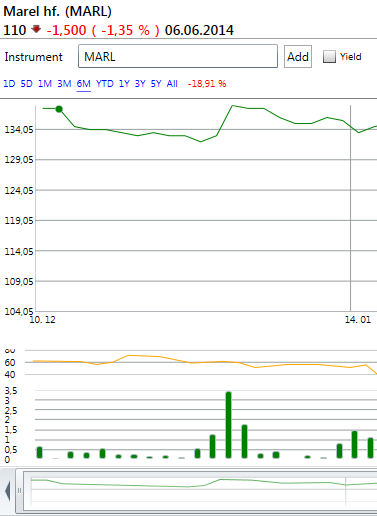
Zoombar
The zoombar is a useful tool to focus on certain spans within a certain timeframe. You can use the handles on the right and left side of the bar to zoom in on the chart, and if you wish to study other parts of the chart using the zoombar you can slide the bar left and right, re-focusing on those parts.
Using multiple instruments
It is possible to add more instruments to the chart. When instruments are added, Kodiak Pro color codes them for easier distinction.
Hide / reveal
After adding instruments you can hide or reveal them by checking / unchecking the boxes in the toolbar.
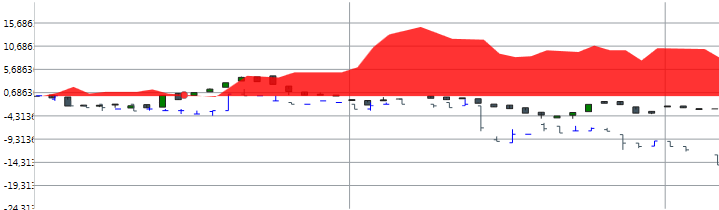
Series types
It's possible to change series type for each graph within the chart. In this screenshot Eimskip (EIM, in green) is being displayed as candle, Marel (MARL, blue), as OHLC and Vodafone (VOICE, in red) is being displayed as area.