...
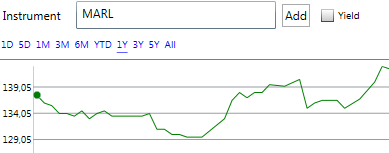
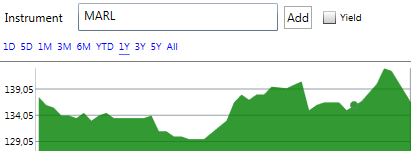
The toolbar is used to add symbols, and choosing what timeframe to display; 1 day, 5 days, 3 months, 6 months, Year to date, 1 year, 3 years, 5 years or all available data. The change in value of the stock for the chosen timeframe is displayed to the side of the timeframe buttons.
Hover over graph
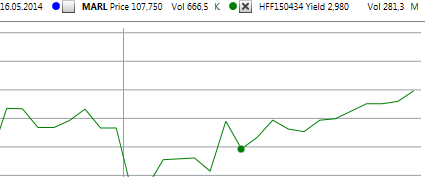
You can get on-point information about the symbol if you use your mouse to hover over the graph. The date you're focusing on is displayed to the right, along with the price and volume at that date.
Display data / Copy data for spreadsheets
...
To re-open the chart, double click the data (or right-click and choose show chart).
Context menu
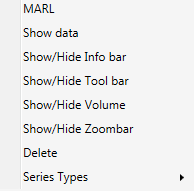
By right-clicking anywhere on the chart you access the context menu. From there you can show or hide most functions within the chart, as well as change the graphs series types and add/remove indicators.
Series types
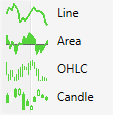
You can choose between four series types
- Line (default). A simple graph showing the symbols progression.
...
- Area. Same as line, but gives a stronger contrast for reading.
...
- OHLC (open-high, low-close) Link to wikipedia.
...

